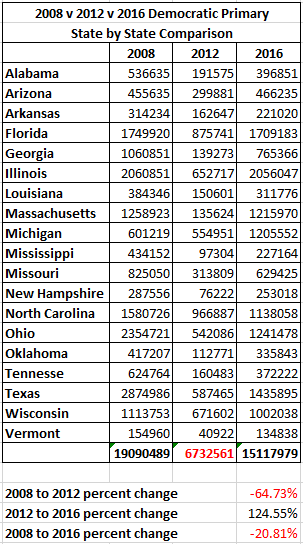
I like to question numbers so I decided to take a look at the numbers used by Breitbart which appeared to be the source of the 20% figure. For 2012’s numbers I used a report from the Bipartisan Policy Center.
Note: The Breitbart graphic has an error listing the percent difference as 2012 v 2016 when it’s 2008 v 2016.
After entering the data and removing the states for which there was no applicable data in 2012, I found the 2008 to 2012 turn out change to be technically accurate but misleading when you look at the intermediate primary and those previous to 2008. When comparing to 2012 the 2016 Democratic primaries will increase by over 124% and will have a better turn out than 1996, 2000 and 2004. Really 2008 was the anomaly in recent years with such a high primary voter turn out. So to address the original commenters statements the 2016 Democratic Primaries turnout are lower than 2008 but they are the second highest in the past six elections. Really though none of this matters as “Primary Turn Out Means Nothing For The General Election“. Primary turn out is such an unreliable indicator that you are really gambling if you are using that as a metric for what the General Election would look like.
Really neither the Republican or the Democratic candidate will be my pick in this race. I plan to vote for Gary Johnson, presuming he gets the Libertarian nomination.
Link to my document if you want to more easily compare on your own.